Skip to content
Jomsolar — Total Solar Solutions

Drone · PV thermal inspection

Looks fine doesn't mean it is fine.

Hot spots on panels and overheating connectors can't be seen from the ground. By the time a problem is visible, it's often already scorched, melted or tripping the system. Catch small problems while they're still small — let a drone take a look first.

01 · FlyA planned flight path covers every row of the array.

02 · ScanEach module is captured in thermal and normal images as the drone passes.

03 · LocateAbnormal heating is pinpointed and marked on the array.

04 · Close-upAfter the flight, a handheld thermal camera checks the inverters up close — terminals and cooling.

05 · ReportEvery finding is ranked by priority, with normal and thermal images side by side, in a written report.

  • No roof climbing
  • No shutdown
  • Every panel captured
  • Problem locations marked

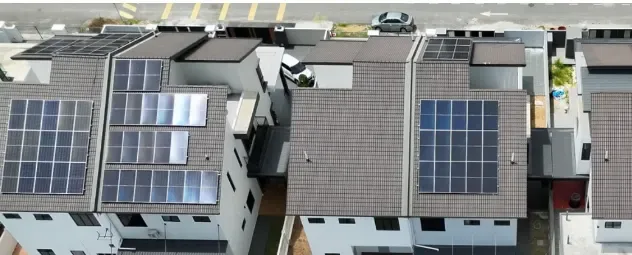
From the air: fast, safe and no disruption

  • No roof climbing

    Nobody walks on your panels, and nobody takes risks on the roof.

  • No shutdown

    The system has to be generating for accurate readings — you keep using power as usual.

  • Large roofs in one visit

    Factories and warehouses are covered row by row, with every panel photographed.

  • Two photos, side by side

    A normal photo and a thermal photo of the same view make it easy to see where the problem is.

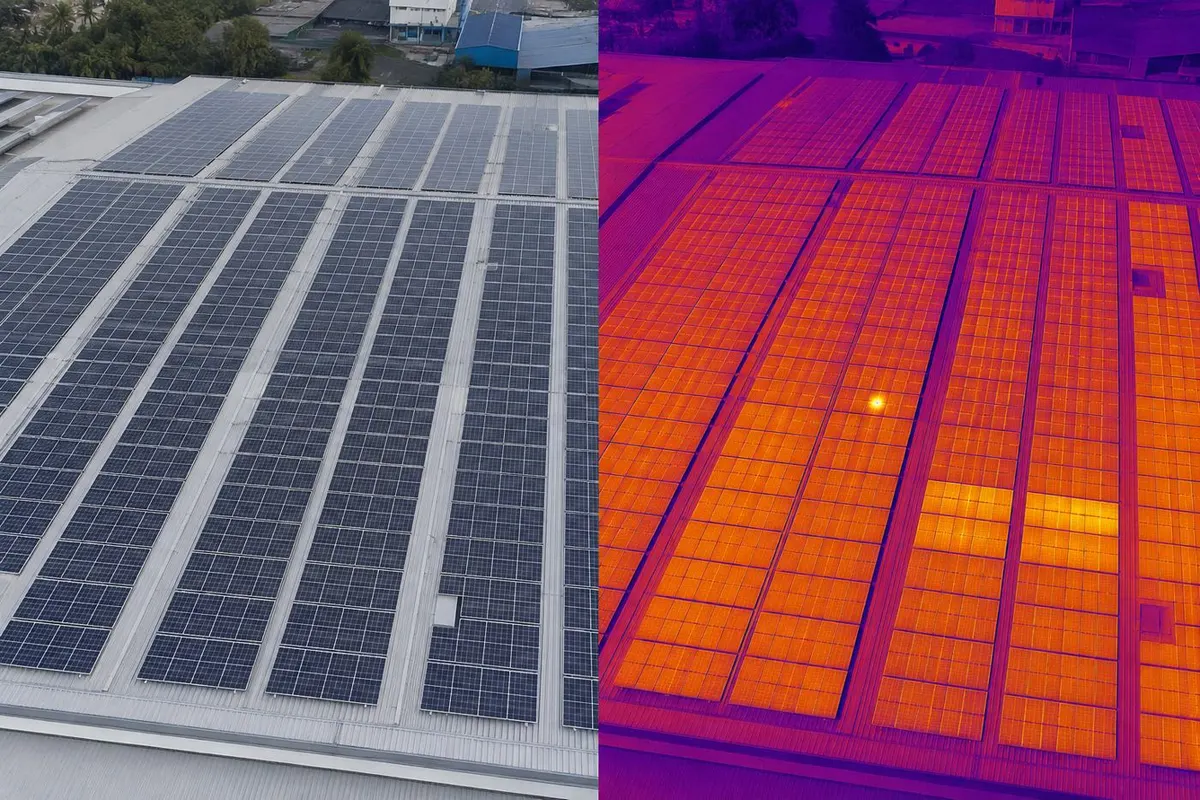
Illustration: the same solar roof as a normal photo and as a thermal image, where a few spots stand out as hotterIllustration

Same roof, two views

Real inspection images

On the left is what you see every day. On the right is what the temperature shows. In the normal photo the array looks neat and even; in the thermal image one spot is clearly hotter than its neighbours — that is the kind of point an inspection is there to find.

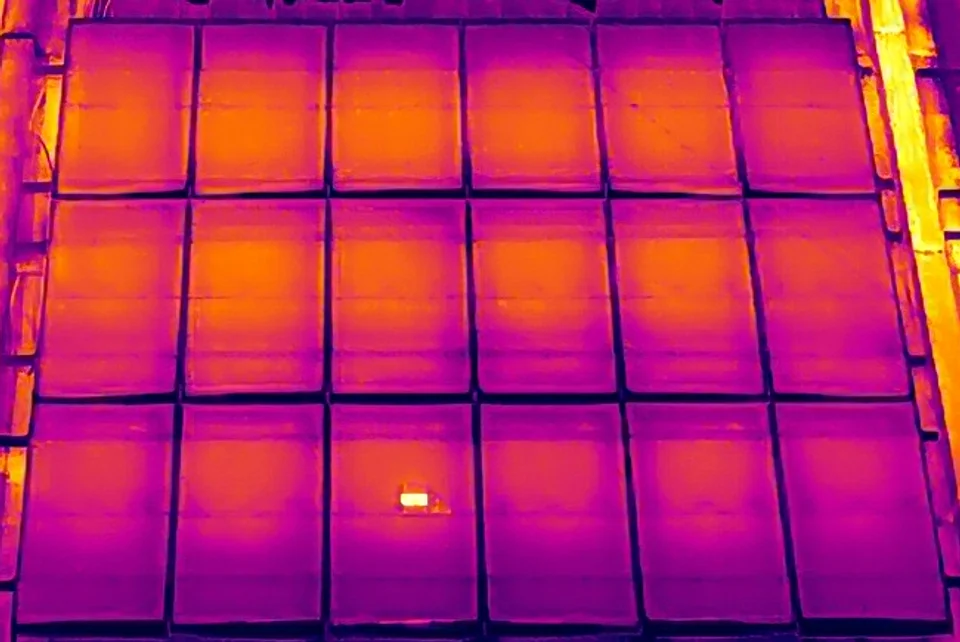
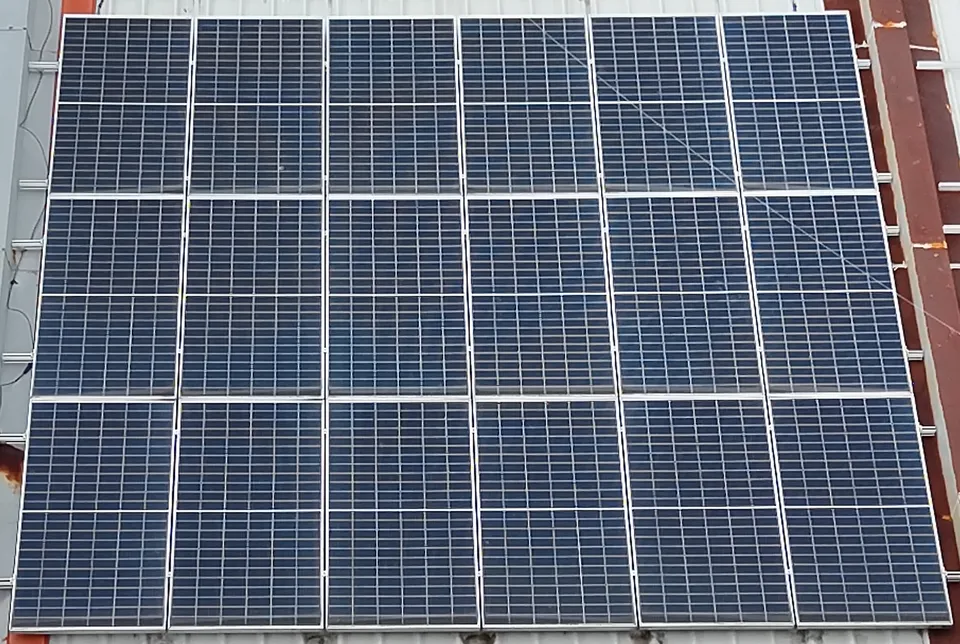
Aerial thermal image of an 18-module rooftop array; one module in the bottom row shows a small, bright hot area
Thermal image (aerial)

Aerial view of an 18-module rooftop array. Module A shows a small, sharply defined hot area; the visible-light photo of the same module shows nothing unusual. Flagged for on-site verification.

The cost of not checking

One overheating panel can cost you in three ways

Cost 1

Lower savings, without warning

Hot panels quietly produce less.

Learn more

A panel with hot spots produces less, and can hold back others in the same string. The system keeps running and the app may show no error — you simply save a little less every month.
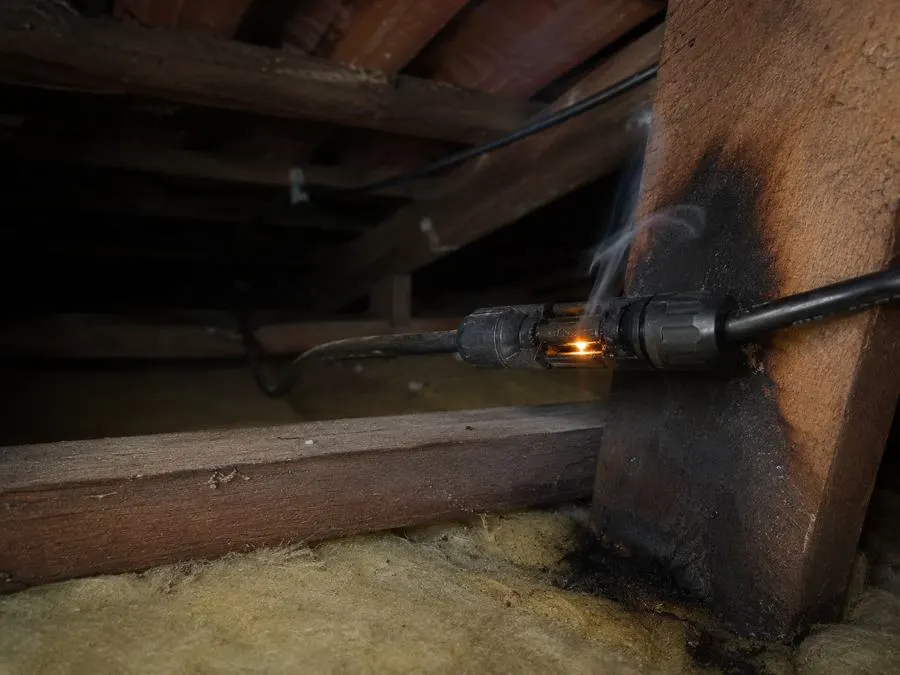
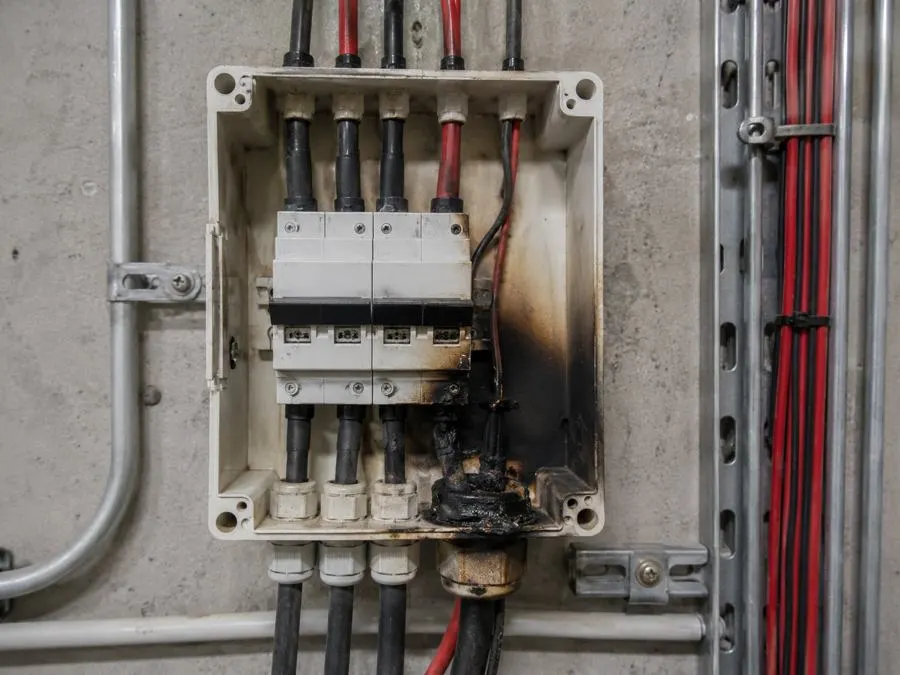
Illustration: a scorched cable connector smouldering against a timber beam in a roof spaceIllustration
Cost 2

Safety, slowly getting worse

Hot connections keep getting worse.

Learn more

A loose or poor connection keeps heating up — the hotter it gets, the worse the contact becomes. It usually happens on the roof or in the ceiling space, where nobody looks.

Illustration: a DC switch box with scorch marks and melted cable insulationIllustration
Cost 3

Repairs that get more expensive

Small fixes turn into big replacements.

Learn more

Found early, the fix may be cleaning or re-making one connection. Left until it burns, it can mean replacing a panel or a whole switch box, plus downtime waiting for parts — and after the warranty ends, it's all at your own cost.

A quick sum (example)

Suppose your system saves you RM 400 a month on electricity —

None of this shows up on a bill to warn you.

Output 10% lowerRM 480 less saved per year
Output 20% lowerRM 960 less saved per year
Left for three yearsup to RM 2,880 less saved

Figures are an example for illustration only and do not represent your system.

How small problems grow

Which level is your system at?

Problems on the roof fall roughly into five levels. Not every problem goes all the way to level 5 — but without checking, you won't know which level you're at.

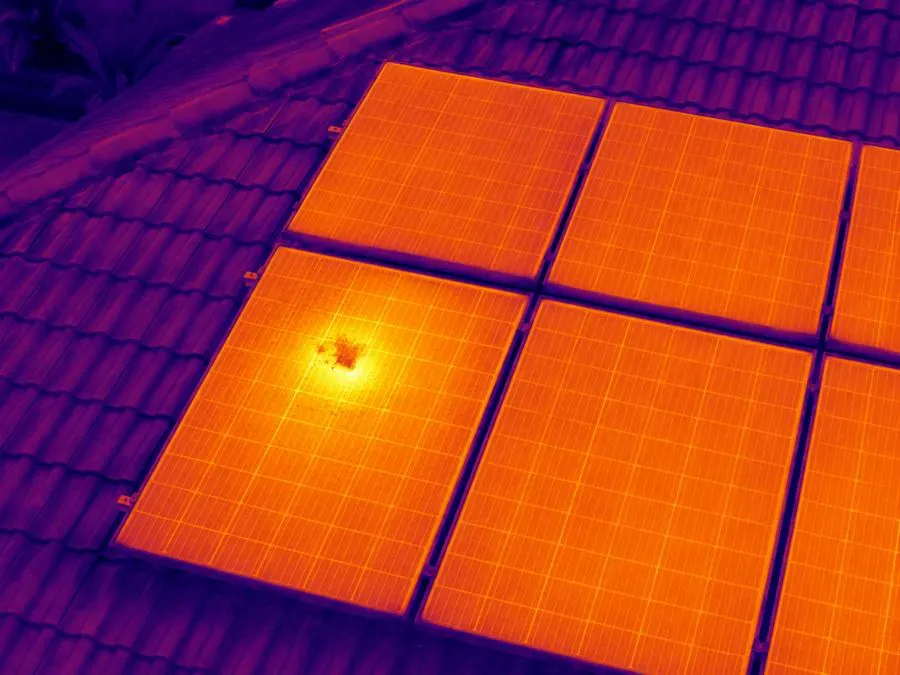
  1. Illustration: thermal image of a panel with one small hot spot where debris covers the surfaceIllustration

    Level 1

    Dirty or shaded

    Bird droppings, leaves or dust cover part of a panel, and that area starts to heat up.

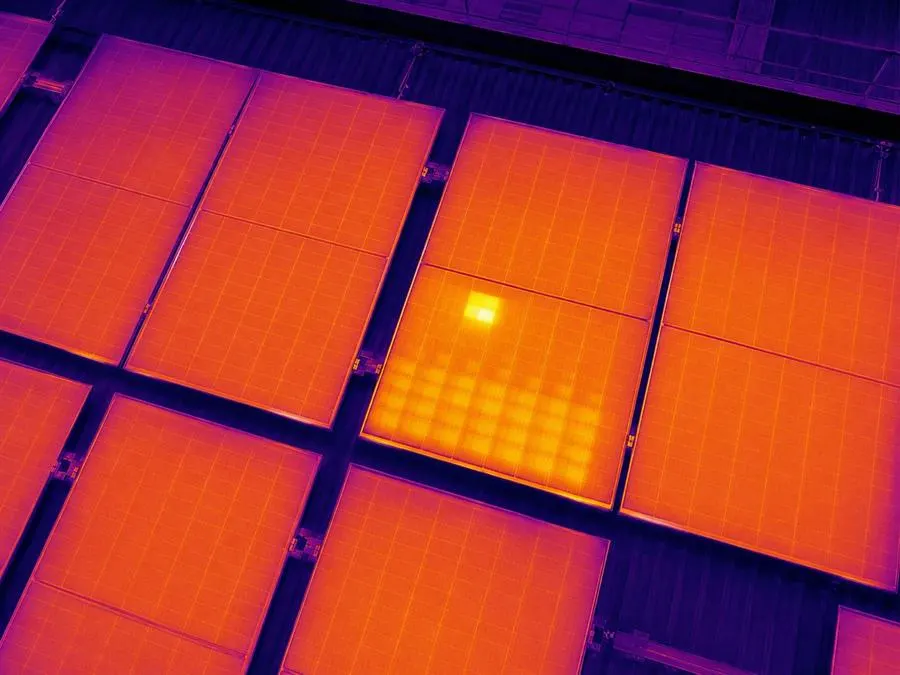
  2. Illustration: thermal image of a module with one very hot cell and a warmer lower halfIllustration

    Level 2

    Hot spot in a panel

    Part of one panel runs much hotter than the rest, and its output drops noticeably.

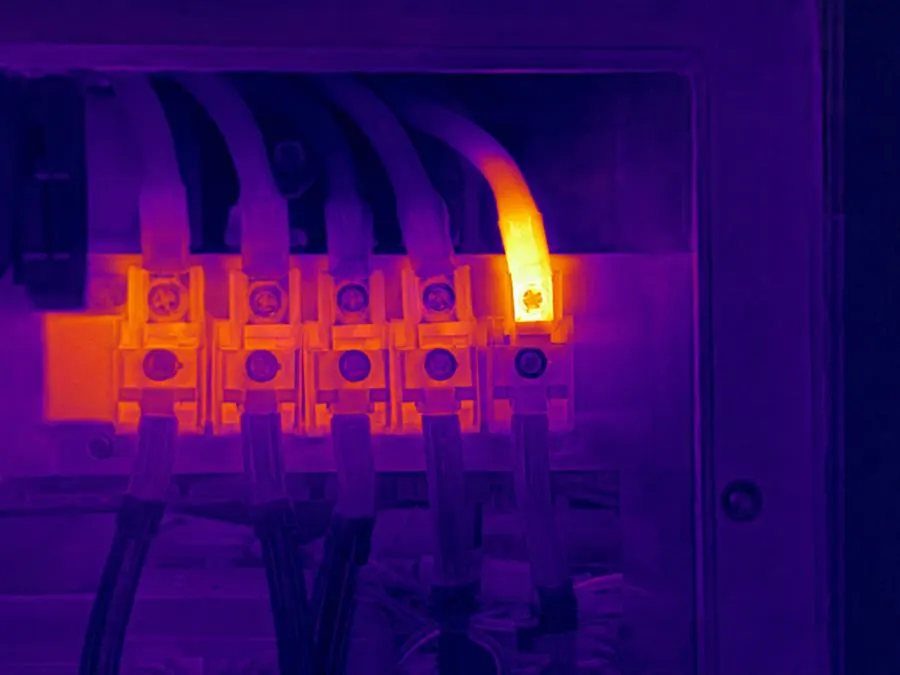
  3. Illustration: thermal image of a terminal block where one connection glows much hotter than the othersIllustration

    Level 3

    Hot connectors or switches

    A poor contact keeps heating, while the outside still looks fine.

  4. Illustration: a DC switch box with scorch marks and melted cable insulationIllustration

    Level 4

    Scorched or melted

    Casings turn black, cables melt, and the system trips and stops.

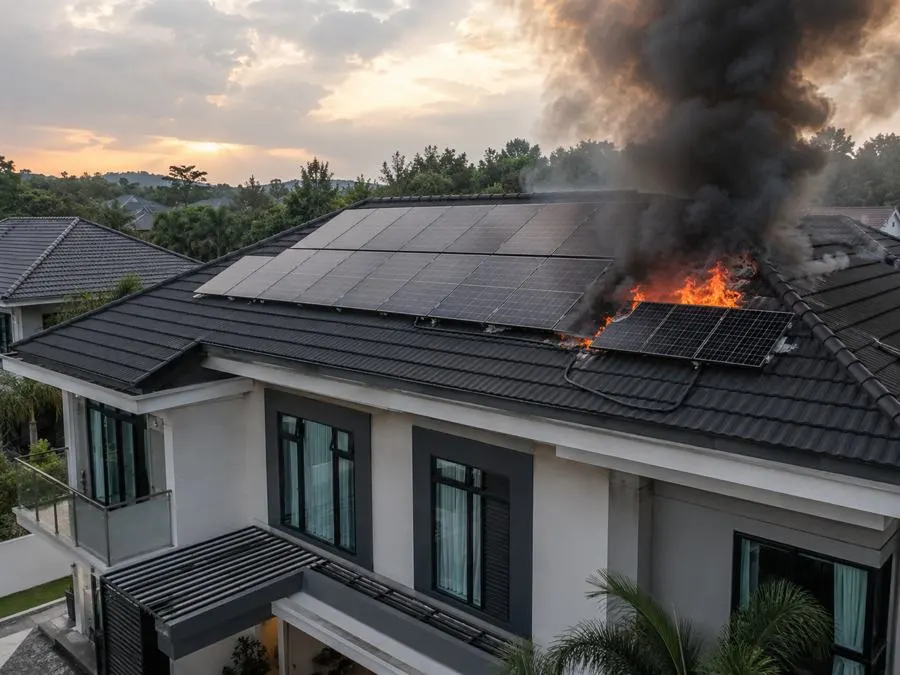
  5. Illustration: flames and smoke rising from a solar array on a house roofIllustration

    Level 5

    Fire

    The worst case: fire reaches the roof and spreads to the building.

Levels 1 to 3 are almost invisible to the eye.

By the time you can see a problem yourself, it is usually at level 4 or 5.

Thermal imaging is for finding problems at levels 1–3.

Straight talk

Do solar panels catch fire? Honestly: rarely. But when they do, it usually starts small.

We don't want to scare you into thinking your roof could burn at any moment — research shows fires are rare. But the ones that do happen mostly start at connectors, DC switches and poorly installed parts — places that tend to show up as heat first.

  • ≈ 1 in 10,000

    In Germany, only around one in 10,000 PV systems has caused a fire with significant damage.

    Fraunhofer ISE & TÜV Rheinland, 2013

  • 36%

    In an investigation for the UK government, about 36% of fires caused by PV systems were attributed to poor installation practices.

    BRE National Solar Centre for BEIS, 2018

  • DC switches & connectors

    The same investigation found DC isolators were the most common origin (26–28 incidents), followed by DC connectors (5–12) — both are points thermal imaging can check.

    BRE National Solar Centre for BEIS, 2018

  • Arcing

    German research found that poorly made or poorly installed DC connectors can loosen and arc, which can directly start a fire.

    Fraunhofer ISE & TÜV Rheinland, 2013

What we check

The exact scope is agreed for each site, based on the equipment installed, safe access and what can be seen without opening live equipment.

  • PV modules

    Hot spots, hot areas, soiling and shading patterns

  • Connectors & cabling

    Heating at visible connectors and cables

  • Combiner & protection devices

    External temperature, where safe and agreed

  • Inverter & battery area

    Surface temperature and ventilation

Enclosures are not opened unless this is agreed in the scope and it is safe to do so.

Battery storage or an indoor inverter? Look at these too.

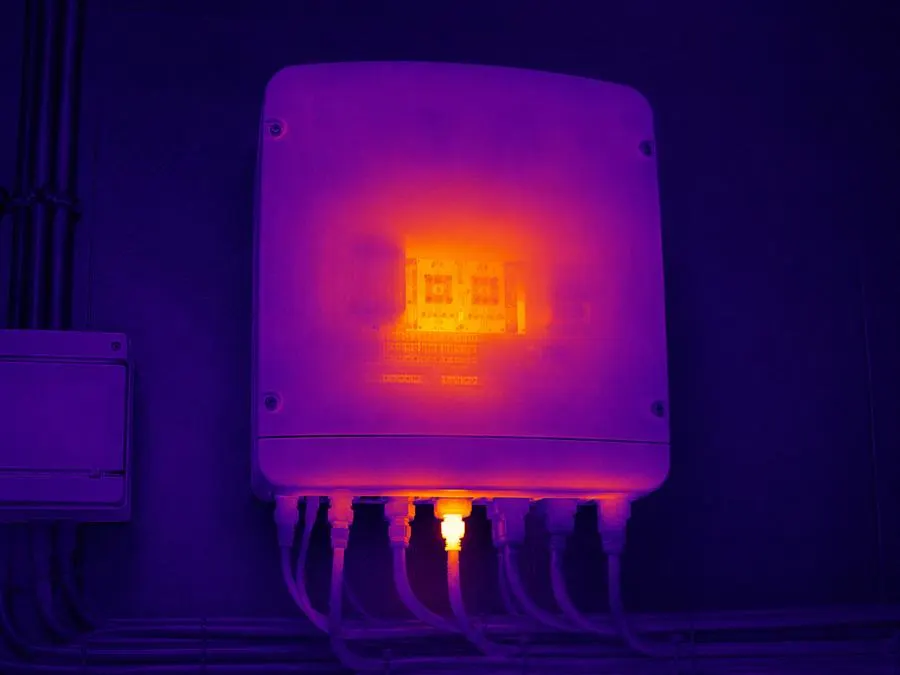
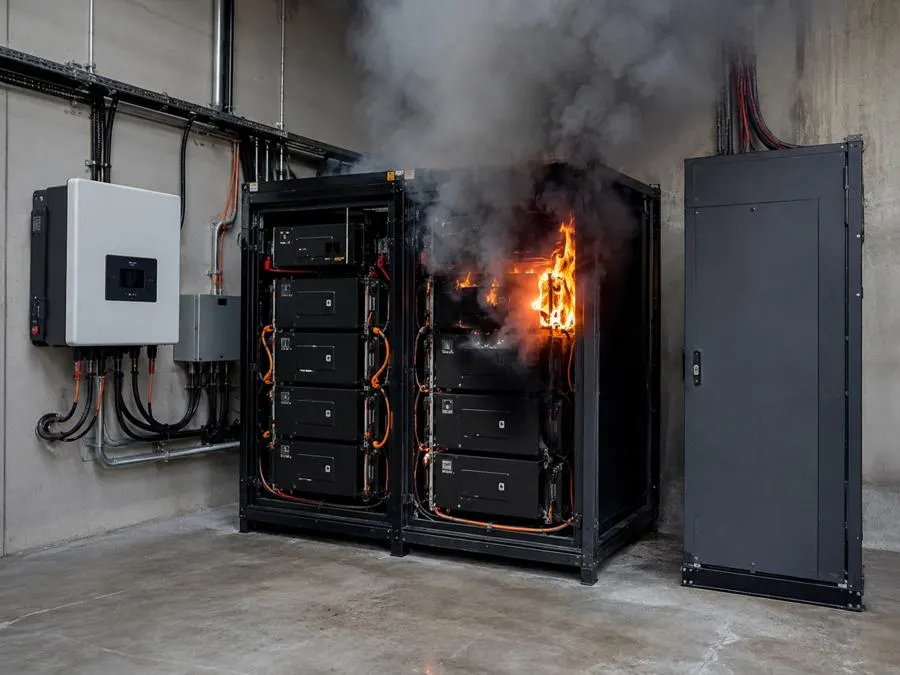
Inverters, battery cabinets and distribution boards work every day, and most sit indoors — in a garage, store room or warehouse. Loose connections and poor ventilation show up as heat first. Besides the roof, we check the inverter and battery close up with a handheld thermal camera.

Illustration: thermal image of an inverter with a hot area inside and one hot cable underneathIllustration
Inverter: a hot area inside and one hot cable underneath
Illustration: a battery cabinet on fire in a garage or warehouseIllustration
A battery cabinet incident affects the whole garage or warehouse

30-second self-check

Tick what applies — does your system need a check?

Tick the ones that match your situation.

0Nothing ticked yet.

How an inspection works

  1. 01

    Send details

    Location, roof photos and system size — plus the number of modules and any issue you have noticed.

  2. 02

    Pick a sunny day

    We schedule around the weather — readings need enough sun — and check access and flight conditions.

  3. 03

    Fly the array

    The drone takes a normal photo and a thermal photo of every panel from the air. Inverters and batteries are checked on the ground with a handheld thermal camera.

  4. 04

    Check each point

    Professional analysis software separates normal heating from abnormal heating; real issues are marked, described and given a priority.

  5. 05

    Deliver the report

    Locations marked, findings ranked and explained in plain language — then we walk you through it.

Standard inspection pricing

Prices cover the on-site inspection. The written report and travel are charged separately — we quote the total before scheduling.

Currently available in Selangor, Kuala Lumpur and Negeri Sembilan.

Request an inspection
  • 1 – 10 kWp

    RM 799

  • Above 10 kWp, up to 20 kWp

    RM 1,500

  • Above 20 kWp

    Quotation on request

What you receive

Every finding comes with photos, a location and a plain-language explanation — a report you can keep, share with your installer, or use when discussing a warranty claim.

Report contents

  1. 1Summary of findings and priorities
  2. 2Site, system and inspection conditions (date, weather, irradiance where measured)
  3. 3Overall roof photo with every finding marked
  4. 4A normal photo and a thermal photo for each finding
  5. 5Plain-language explanation: what we saw and what it may relate to
  6. 6Priority and recommended action for each finding
  7. 7Limitations of the inspection
  8. 8One walkthrough of the results — and questions by WhatsApp any time

Exact deliverables follow the scope agreed with you.

Jomsolar · Report page sampleFinding A
Illustration: thermal image of a module with one very hot cell and a warmer lower halfIllustration

Finding A

Location
Row 3 · Panel 5
Observed
One small area much hotter than the rest
Priority
🟠 Schedule a check
Recommendation
Close visual check of this panel

One cell in this panel is much hotter than its neighbours, and the lower half of the panel is also warmer — output may already be affected. We suggest a close visual check first, then further testing once dirt has been ruled out.

Sample page for illustration — the content is an example, not an actual inspection result.

How findings are prioritised

🔴 Act promptly

Significant abnormal heating, or heating at connections or protection devices. Arrange an on-site check promptly.

🟠 Schedule a check

A clear panel-level anomaly. Plan verification and, where relevant, a warranty discussion.

🟢 Keep monitoring

Minor or diffuse patterns such as soiling or shading. Recheck after cleaning or at the next inspection.

Example priority scheme — final criteria are stated in each report.

If an anomaly is found

A thermal image shows where temperature differs; it does not on its own identify the cause. Typical next steps are:

  • Close-up visual check of the affected module or component
  • Cleaning, if soiling or debris is suspected, then a recheck
  • Electrical testing where appropriate (for example string measurements)
  • A warranty discussion with the installer or manufacturer, supported by the image evidence
  • Repairs quoted separately based on the findings — or pass the report to your original installer

Preparation and limitations

  • The system must be operating under load, in steady, strong sunlight. Heavy cloud or rain means we reschedule.
  • Drone flights depend on site conditions, airspace restrictions and permission from the property owner or building management.
  • We need safe access to the inverter and related equipment on the day.
  • Parts hidden under modules or inside enclosures may not be visible.
  • Some faults produce no heat at the time of inspection; thermal imaging cannot detect every electrical fault.

Why now

Don't leave it for “next time”

Fewer sunny days in the rainy season

Thermal imaging needs strong, steady sunshine. With afternoon thunderstorms and the monsoon months, suitable flying days become fewer.

Every month's delay is a month's loss

Lost generation can't be recovered. The earlier a problem is found, the less you lose.

The warranty won't wait

Finding problems while still under warranty — with photos and locations on record — makes a replacement claim with the supplier much easier.

For installers, cleaning companies and asset owners

We provide independent third-party thermal inspections, with reports you can share with your clients or use for your own records.

  • Handover checks on newly installed systems
  • Before-and-after comparisons for panel cleaning
  • Periodic inspections for O&M and asset portfolios

Partner arrangements and report branding are agreed case by case.

Discuss a partnership

What to include in your enquiry

  • Site location
  • System capacity (kWp)
  • Roof or ground mounted
  • Number of modules
  • Drawings or layout, if available
  • Any issue you have noticed
  • Preferred inspection date
  • Contact person on site
Request an inspection

Don't wait until you can see it.

While sunny days are still frequent, give your panels a “temperature check”. Send us these details and we'll take a first look, then advise how to arrange it:

  • Installation location
  • Roof photos
  • System size
  • Years since installation
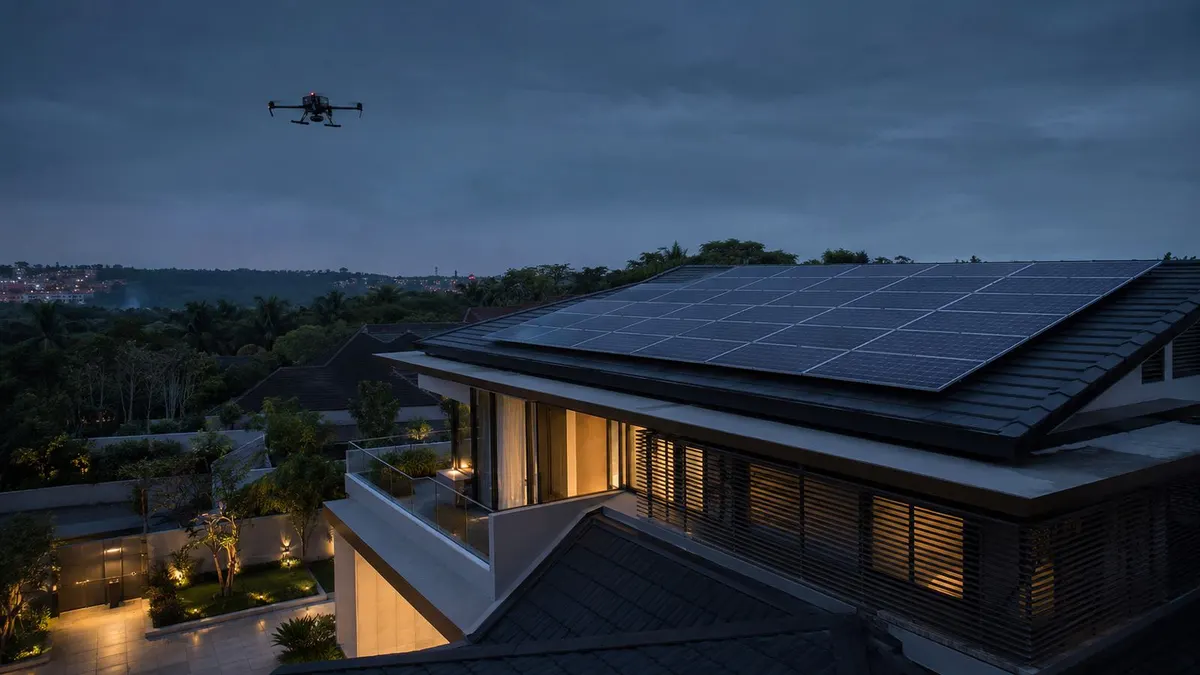
Illustration: a drone flying over a house with rooftop solar panels at duskIllustration
Notes and sources

Images marked “Illustration” show situations that can occur; they are not results from any client site. Only images marked “Real inspection images” come from an actual inspection. Thermal images provide clues to anomalies; on their own they cannot confirm the cause of a fault, nor guarantee that fire or other damage will be avoided. Sunlight, weather, shading and how the system is operating all affect results, and further checks may be needed. Drone flights depend on site conditions and applicable regulations. Amounts in the “quick sum” are an example.

Sources

WhatsApp usBook inspection